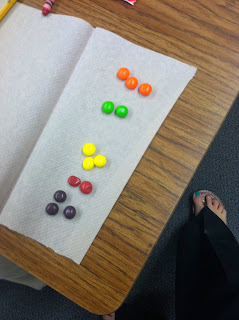
The first thing that made a huge difference in my kids understanding of graphing was using Teaching from the Core's idea to help kids understand the term difference. Every year when I was teaching first grade, the kids were great with representing data, great with answering questions like which had the most, how many had this, etc - but when it came to how many more or how many fewer did one graph item have over the other....it was a disaster. So, while reading through all of my favorite blogs I stumbled upon her post. You can check it out here... I used it this year with my 2nd graders and they got it! And, what a fun way to learn it.
Another great item I stumbled upon was Sunny Day's in 2nd Grades Math Common Core Assessment Packet. This thing is fantastic! There are 3 math pages for each Common Core Standard. I purchased it and have loved using it! I use one of the pages as a pre-test so I know what areas I need to focus on when teaching the standard, another page as homework, and the last page as the post-test.
Now, on to graphing...
In my graphing packet, you'll find some practice pages, where students need to take the tally graph data, turn it into a bar graph, and then answer questions about the graphs.
You'll also find a Favorite Book graph. This is a great way for a whole class activity or a survey activity that students could do independently. I used this activity whole group and we asked each student in the class, which book was their favorite and filled in the tally graph accordingly. The kids had a lot of fun and I love when we can represent them and their opinions in the graph.
The next graph was a fan favorite of the kiddos. This was during Halloween week so I bought some of those fun size Skittle bags and we graphed the colors they found in their bag. Their favorite part...eating them when they were done graphing. My favorite part...seeing that they were getting the concept of representing data and how to use it to answer questions.
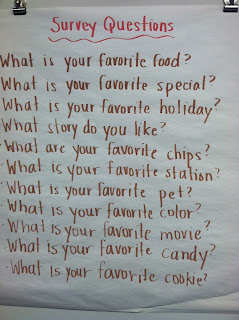
The last graphing activity we did before the post test was a survey of the class. This turned out better than I imagined. First, we came up with possible survey questions that kids would maybe want to ask each other. Afterwards, the students fill out their survey question sheet with a question they wanted to ask their fellow students and the four answers that would go with it. They loved this! Afterwards, they got to go around the room and ask each student their question and represented their response in their tally graph. Once their tally graph was filled out, they transferred the tally graph information into the bar graph and answered the questions. For my students that finished early, I challenged them to come up with other questions they could ask about their graph on the back of their page.
Please check out my Graphing Packet in my TPT Store!!
Hope everyone is having a great long weekend!


This is a wonderful blog post. It's pure magic from you! This is the most wonderful post I have ever seen. With this, you have really made my day. Keep up the good work! Making your decision may be made easier by reading this article about Wheel Decide. It allows you to create your own digital wheel for decisions, raffles, games and prizes.
ReplyDelete